QlikMaps Demo Webinar
Register for EventWhat Can QlikMaps Do For You?
Add rich, interactive location analytics to your Qlik apps
Make discoveries in your data that charts and graphs just can’t reveal
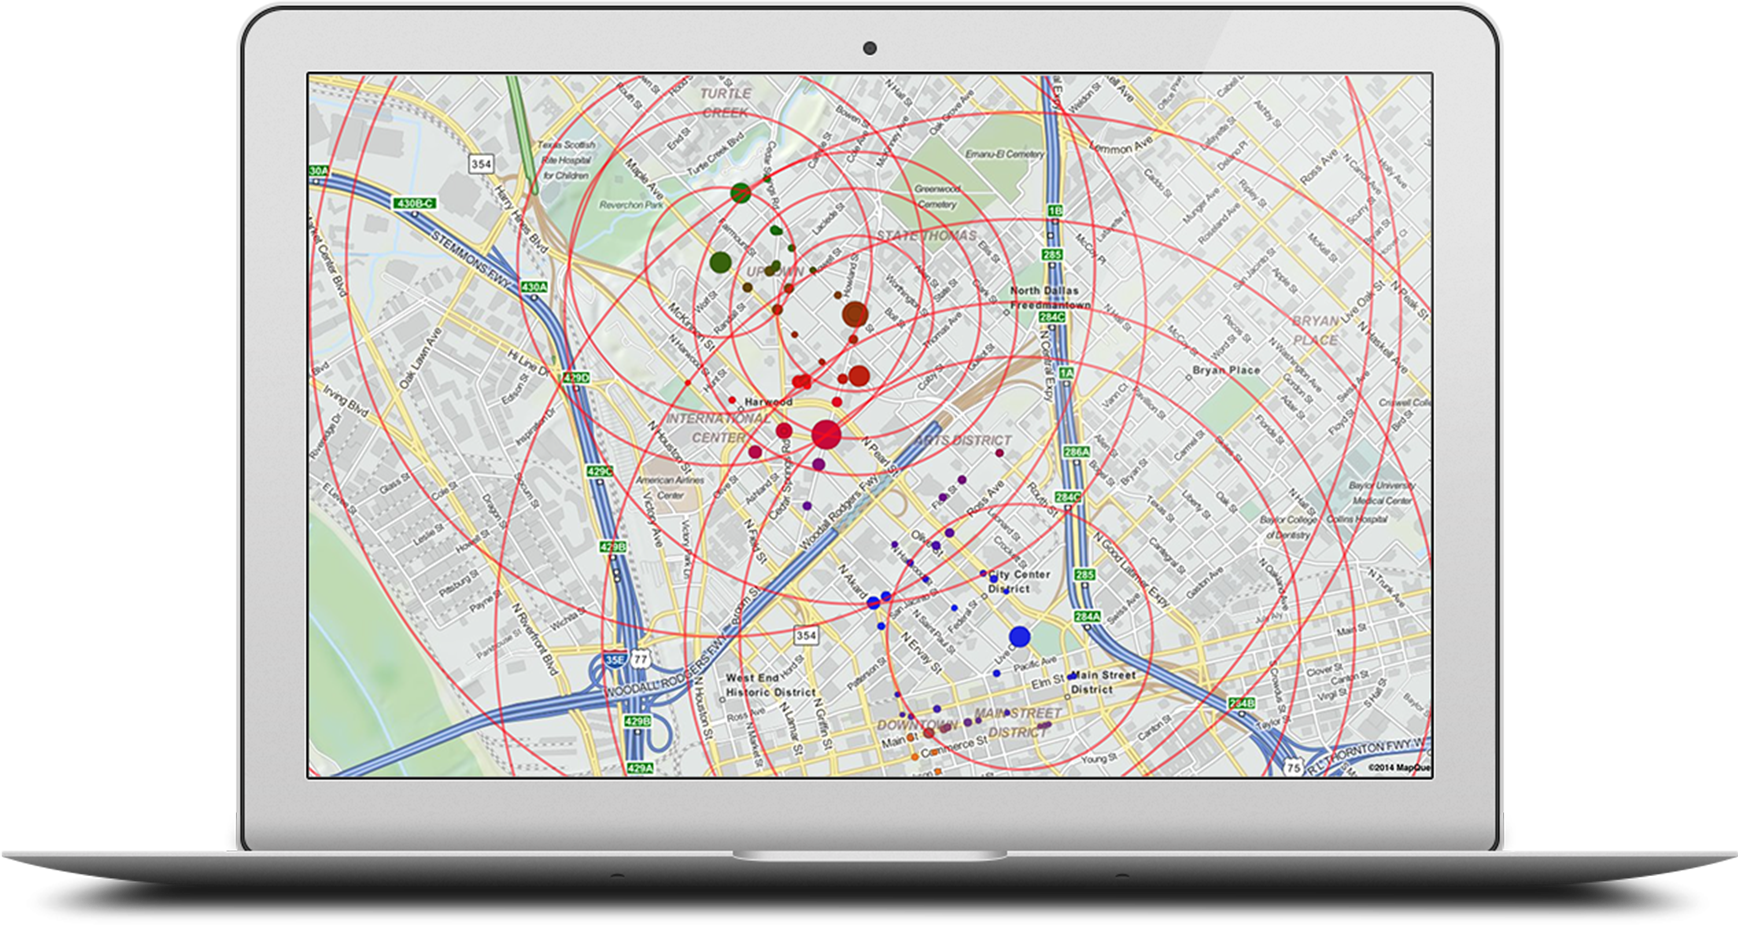
Combine maps with demographics, consumer spending, weather data, crime statistics, and more to get a rich, geocentric view
Get the power of a Geographic formation System without the cost and complexity
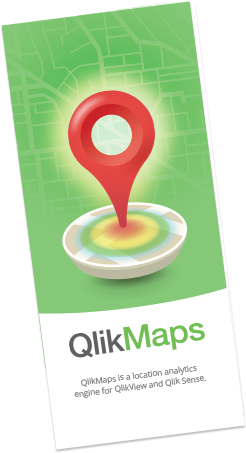
Interested in QlikMaps?
Download additional product information
Additional Features
Uncover New Patterns and Understand Your Business in New Ways
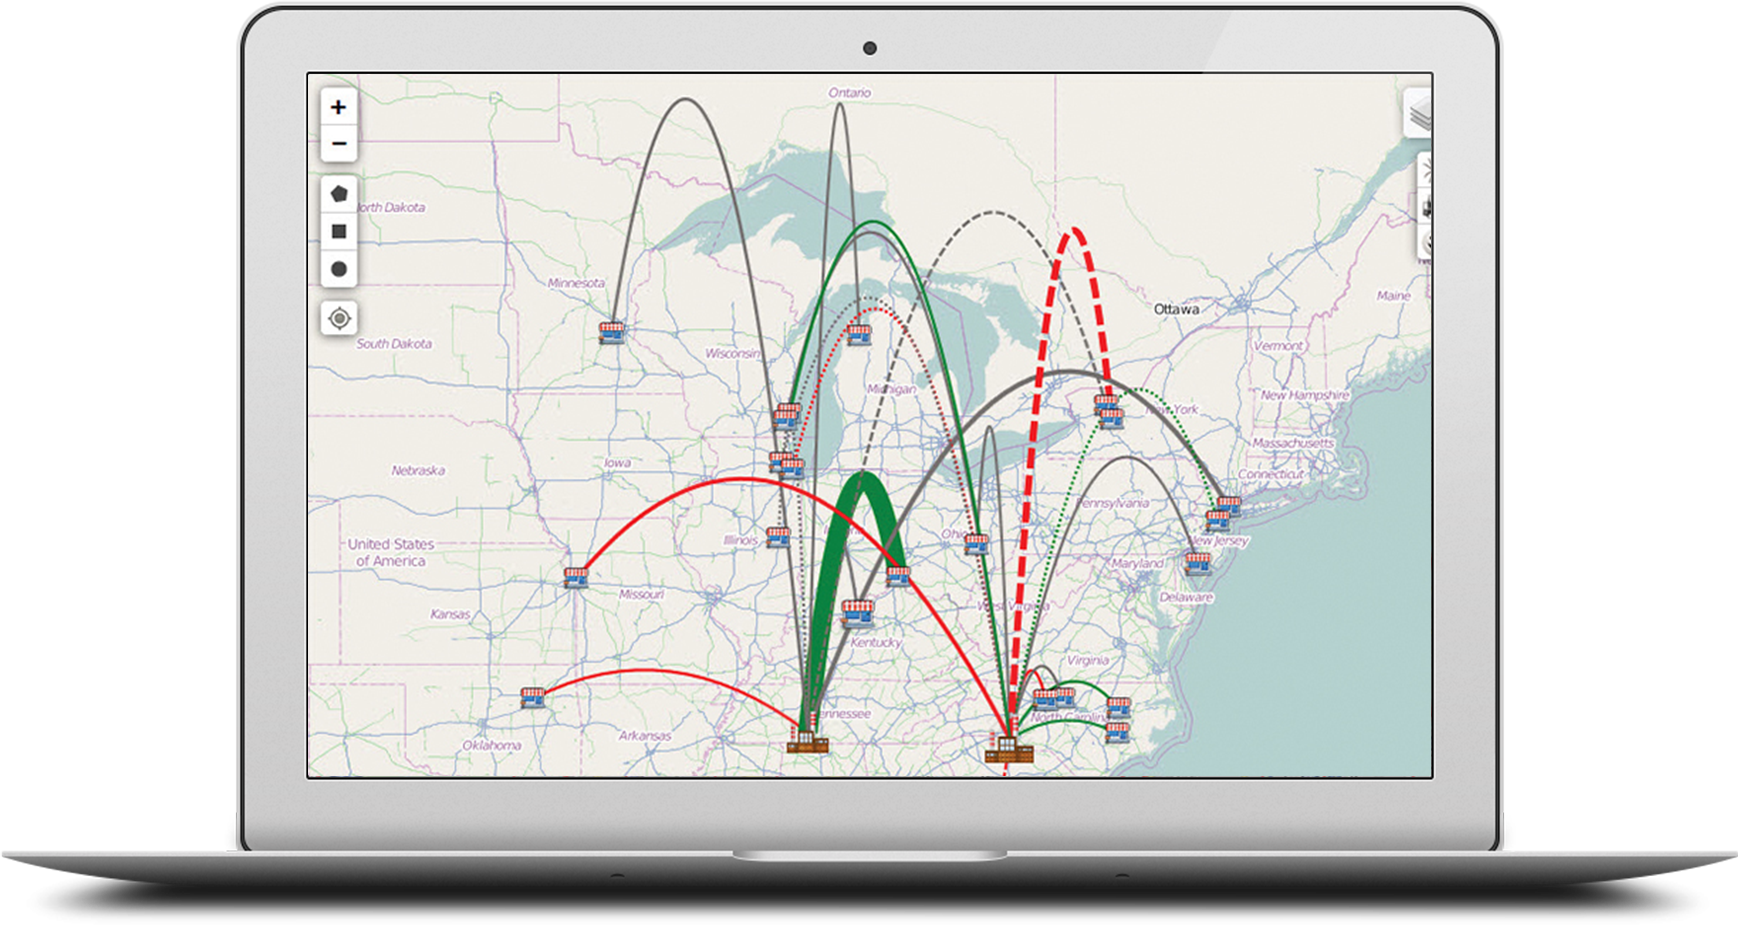
Seeing and analyzing your business data in the context of its location can help you understand your business in new ways. Make discoveries that graphs, charts, and other visualizations just can’t reveal. Detect patterns that weren't apparent before.
Perform Map-Driven Analysis
When you interact with any other Qlik visualization or selector, the changes are automatically shown in QlikMaps. The opposite is also true: any interactions you make with QlikMaps also affect the rest of the Qlik dashboard.
Get Started Within Minutes
QlikMaps is easy to install and configure, so you can start creating mapping visualizations within minutes.
Use QlikMaps To:
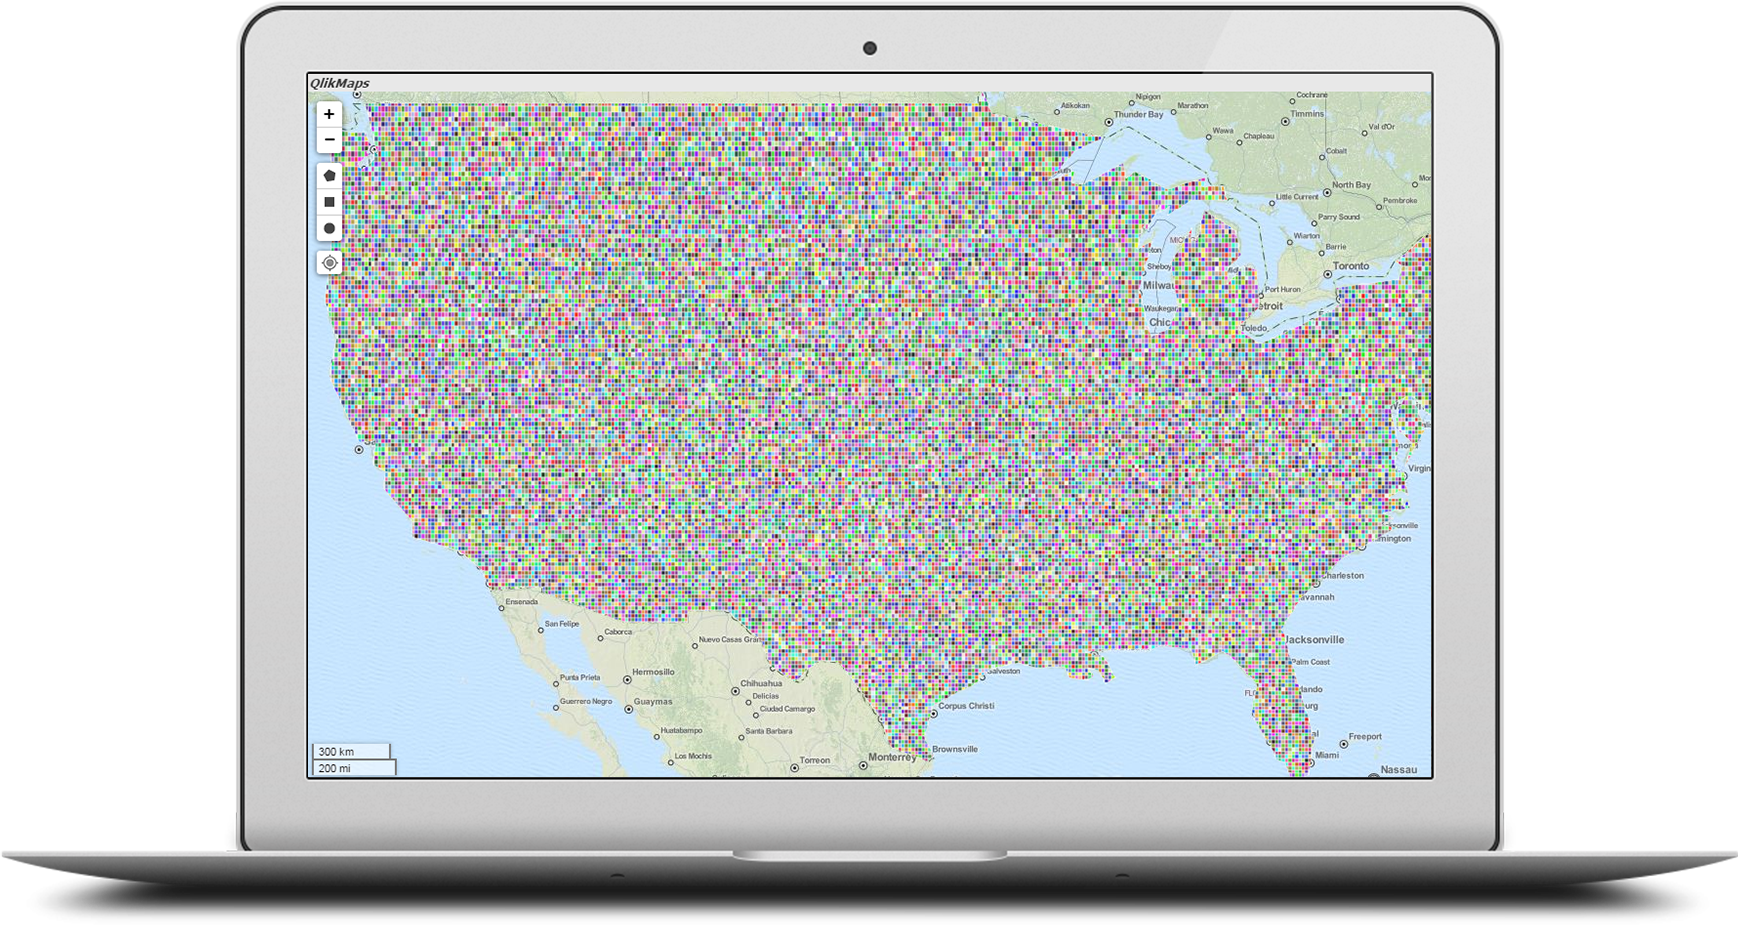
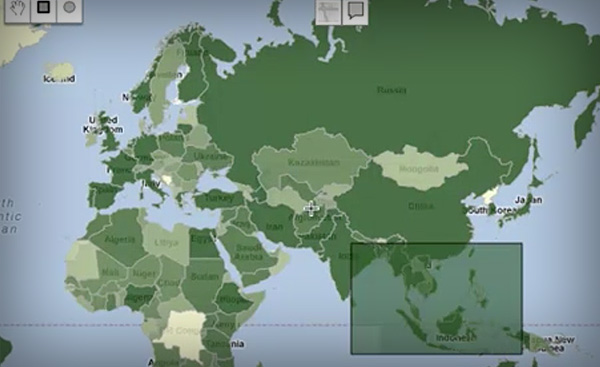
- Plot territories, polygons, heat maps, points, and density maps
- Lasso points and polygons on a map to make selections
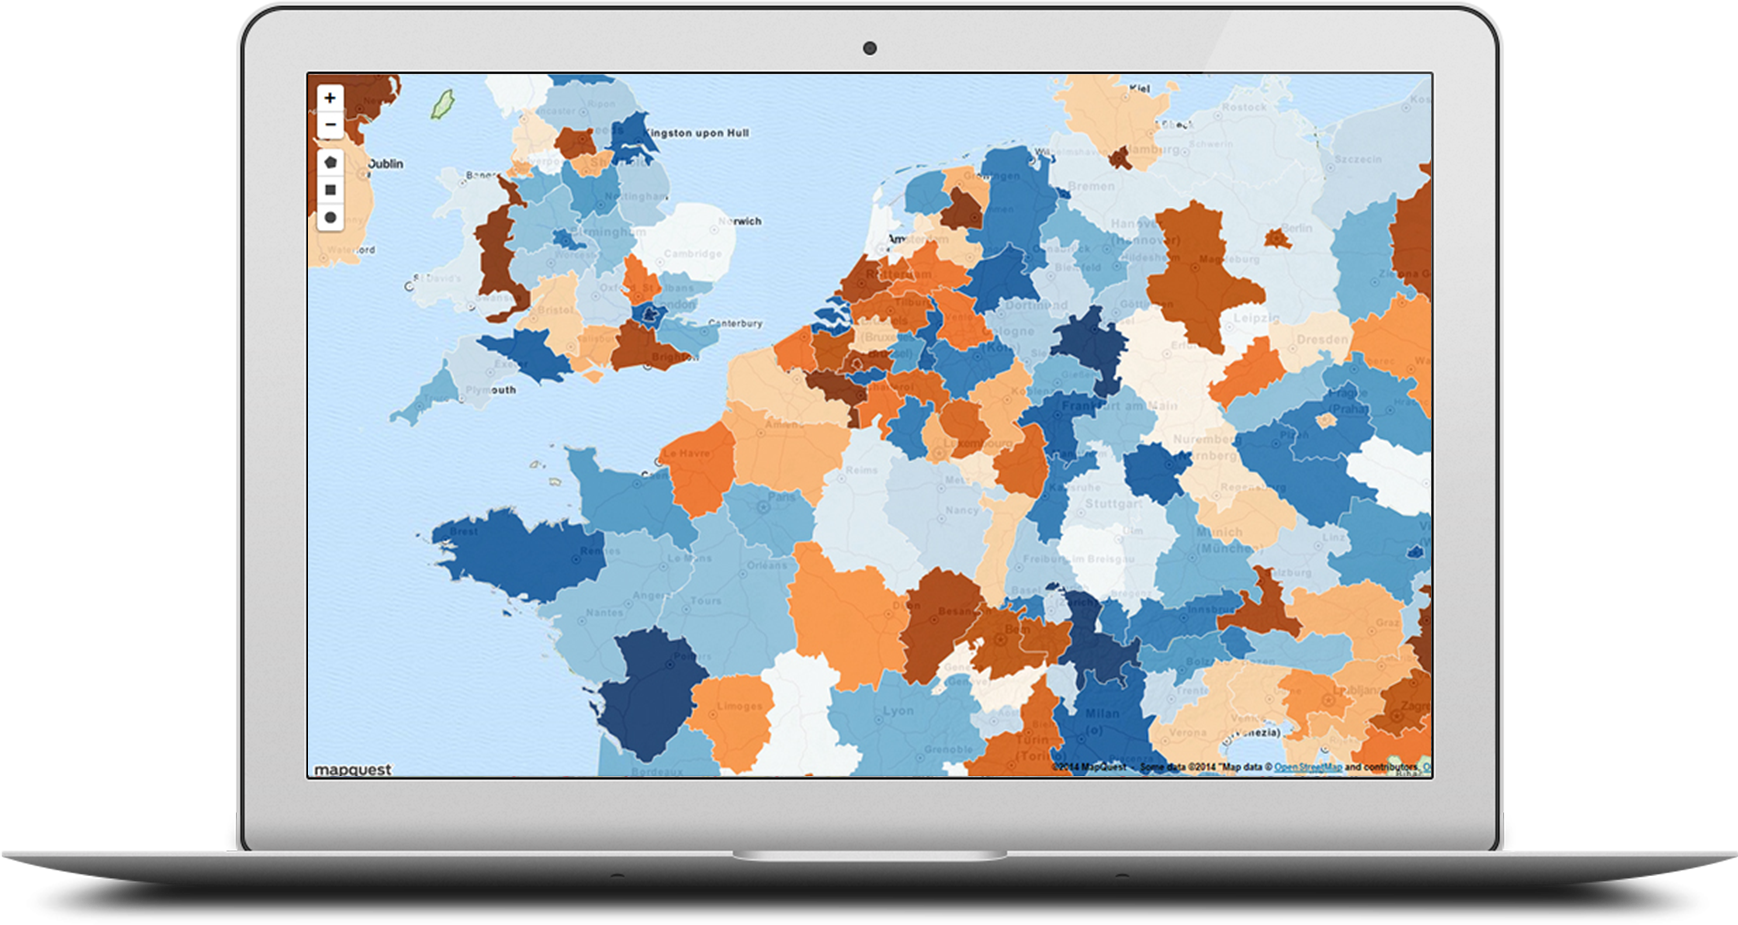
- Get out-of-the-box support for most international administrative boundaries
- Use custom regions
- Integrate with ESRI shapefiles and KML files at no extra cost
- Get real-time overlays from external ESRI, WMS, and WMTS/ Tile layer data sources.
- Overlay weather data from NOAA or demographic info directly from the US Census
- Perform location analytics / geospatial analysis based upon your current location
- Get true multi-layer support – add or remove any layer type with a click of a button
- Create custom pop-ups to add more meaning and detail to your map
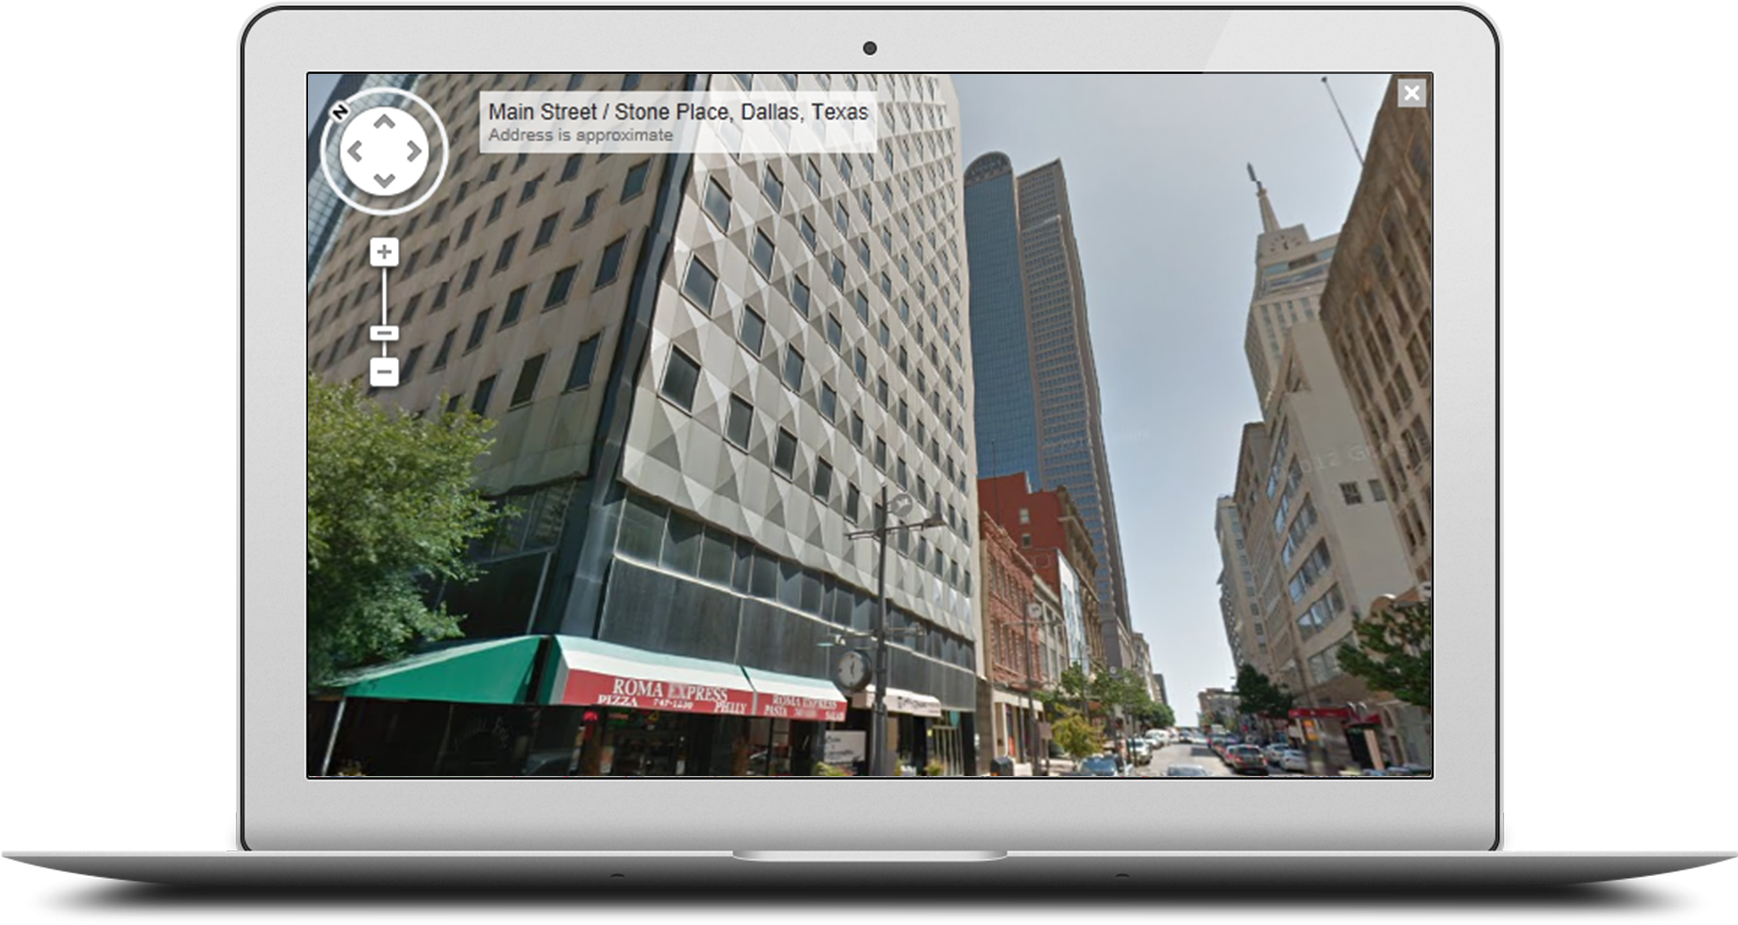
- Overlay results of a google search query without having to update the data model
Location Analytics Made Simple:
- Simple architecture: No extra server required
- Simple compliance: All third party licensing included
- Simple development: It’s as easy to create mapping visualizations with QlikMaps as it is to create anything else in Qlik
- Simple UI: No end user training required
- Simple deployment: Get started within minutes
- Full functionality from all devices
Resources
- Location Analytics Worksheet: Need help deciding what location analytics tool will work best for your company and what features you really need? Download our worksheet that walks you through what to consider when picking a location analytics tool.
- QlikMaps Demo Webinar: Join our next 30-minute webinar where we give an overview of QlikMaps features and functionalities.
QlikMaps Customers
Partners
Recorded Webinars
Upcoming Events
Already a Customer?
Already a customer? Download helpful documents that will make your life easier.
View all downloads including installation files, tutorials, and more.
Easily search for tips, tricks, support, and up-to-the minute documentation.
